Market Statistics

2023 Central Texas Housing Market Report

AUSTIN, TX — In 2023, the median price for a home in the Austin-Round Rock MSA decreased 10.2% to $450,000, according to the Austin Board of REALTORS® December 2023 and Year-End Central Texas Housing Market Report. When compared to the steep 24.2% decline in pending sales in 2022, 2023 saw a slight 3.0% decline to 30,353 sales emphasizing that the Central Texas housing market continues to find its footing despite macroeconomic factors impacting the broader housing market and economy.

Share This:

CENTRAL TEXAS HOUSING MARKET REPORT | December 2019

EXECUTIVE SUMMARY | December 2019
While Austin continued to rank high on “Best of U.S.” lists, Central Texas REALTORS® sold more homes in 2019 than
any year on record—33,084 home sales and $13,158,737,333 in sales volume.
“Austin’s unprecedented population growth during the past decade has heavily impacted the real estate market.
Compared to 2010, home sales in 2019 increased by 84%,” Romeo Manzanilla, 2020 ABoR president said. “That type of
exponential growth has put enormous pressure on the market, raising the median home price from $193,520 in 2010 to
$318,000 in 2019. As we look forward to this year, the market is not showing signs of slowing down anytime soon.”
In the Austin-Round Rock MSA—now the 30th largest U.S. metropolitan area—the median price for single-family
homes increased by 2.6% to $318,000 in 2019. During the same period, sales increased by 7.2% to 33,084 sales. New
listings for the five-county MSA increased year over year by 1.4% to 39,309 listings in 2019. Active listings decreased
4.3% to 6,216 listings, but pending sales increased 10.5% to 33,976 pending sales.
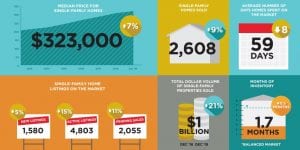
In December 2019, sales volume in the Greater Austin area increased by 9.2% to 2,608 sales, while inventory decreased
by 0.5 months to 1.7 months of inventory. Growing demand pushed the median price of a single-family home to
$323,000, a 7.1% increase from December 2018.
“If we don’t take action to increase housing supply in Austin, we will continue to see exponential increases in home
values,” Manzanilla said. “ABoR continues to advocate for an updated land development code in Austin for exactly this
reason—so that folks who want to purchase a home in the area can afford to do so.”

Share This:

2015 Year In Review | Austin Real Estate Stats

Austin Real Estate Market Statistics

2015 Year-End Totals

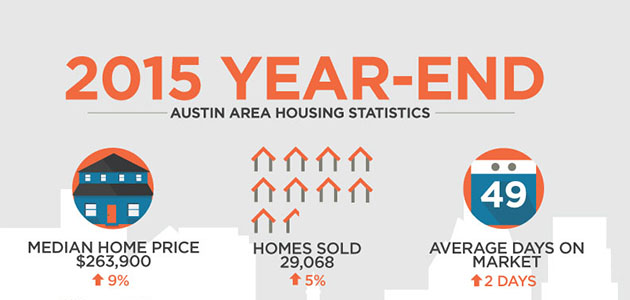
  • 29,068 – Single-family homes sold, five percent more than 2014.2015 Year In Review: Austin Real Estate Stats
  • $263,900 – Median price for single-family homes, nine percent more than 2014.
  • $333,558 – Average price for single-family homes, eight percent more than 2014.
  • 49 – Average number of days that single-family homes spent on the market, two days more than 2014.
  • 36,810 – New single-family home listings on the market, four percent more than 2014.
  • 6,044 – Active single-family home listings on the market, five percent more than 2014.
  • 29,839 – Pending sales for single-family homes, five percent more than 2014.
  • $9,695,852,178 – Total dollar volume of single-family properties sold, 13 percent more than 2014.

The following sections describe trends in other sectors of the Austin-area real estate market.

Townhouses & Condominiums

The number of townhouses and condominiums (condos) sold in the Austin area in December 2015 was 230 properties, unchanged from December 2014. The median price for condos was $250,000, which is eight percent more than the same month of the prior year. These properties spent an average of 46 days on market, 10 days fewer than in December 2014.

In 2015, Austin-area condo sales dipped three percent from the year prior to 3,057 condo sales. Median price for Austin-area condos was $227,700, a six percent increase from 2014. Condos spent the same amount of time on the market in 2015 as 2014, or an average of 43 days.

Leasing

In December 2015, a total of 1,153 properties were leased in Austin, which is three percent less than December 2014. Properties spent an average of 47 days available for lease, or two fewer days than December 2014. The median rent for property leases was $1,500 per month, a three percent increase from December 2014. Active property listings increased three percent from December 2014 to 1,630 properties. In all of 2015, a total of 17,875 properties were leased in Austin, which is five percent more than 2014, and the median rent was $1,540 per month, or four percent more than 2014.


All information above is credit to Austin Board of Realtors.

Share This:

June 2015 Austin Real Estate Stats

Austin Real Estate Market Statistics
Austin-area home sales top 3,000, $1 billion in volume in June 2015, prices remain high;
Mid-year results show 2015 on pace to exceed historical sales volume in 2014

Austin Board of REALTORS® releases real estate statistics for June 2015 and mid-year 2015

AUSTIN, Texas – July 21, 2015 – According to the Multiple Listing Service (MLS) report released today by the Austin Board of REALTORS® (ABoR), Austin-area home sales topped 3,000 sales for the first time since July 2013, increasing five percent year-over-year to 3,051 sales for the month of June. Mid-year statistics show that Austin-area home sales increased an average of four percent year-over-year to 13,917, putting 2015 on pace to potentially exceed 2014’s historical high in sales volume.

In June 2015, total dollar volume reached $1,018,625,166 and increased by eight percent compared to June 2014. Additionally, the total dollar volume of single-family properties sold in the first half of 2015 was $4,617,178,959, a year-over-year increase of 12 percent.

Barb Cooper, 2015 President of the Austin Board of REALTORS¬®, explained, “June’s increased home sales, combined with total dollar volume exceeding $1 billion for the first time ever, shows the amazing equity Austin homeowners have in the market and the powerful impact of real estate in Central Texas. However, this increase heightens the need to replenish and expand housing stock to help achieve sustainable growth.”

According to the report, the median price for Austin-area single-family homes increased eight percent year-over-year to $272,250 in June 2015, while average price increased two percent to $333,866 during the same time frame. Keeping with the upward trend over the last several months, less than three in 10 single-family homes sold in the Austin area were priced below $200,000.

Price increases are similar for the first half of 2015, with median price increasing 10 percent to $263,000 and average price increasing eight percent to $331,765. At the same time, homes spent an average of 50 days on the market, three more days than the same time last year.

“If this growth continues, 2015 could become another historical year for Austin-area home sales. Both homebuyers and sellers can expect a strong, competitive market for the rest of the summer selling season,” said Cooper.

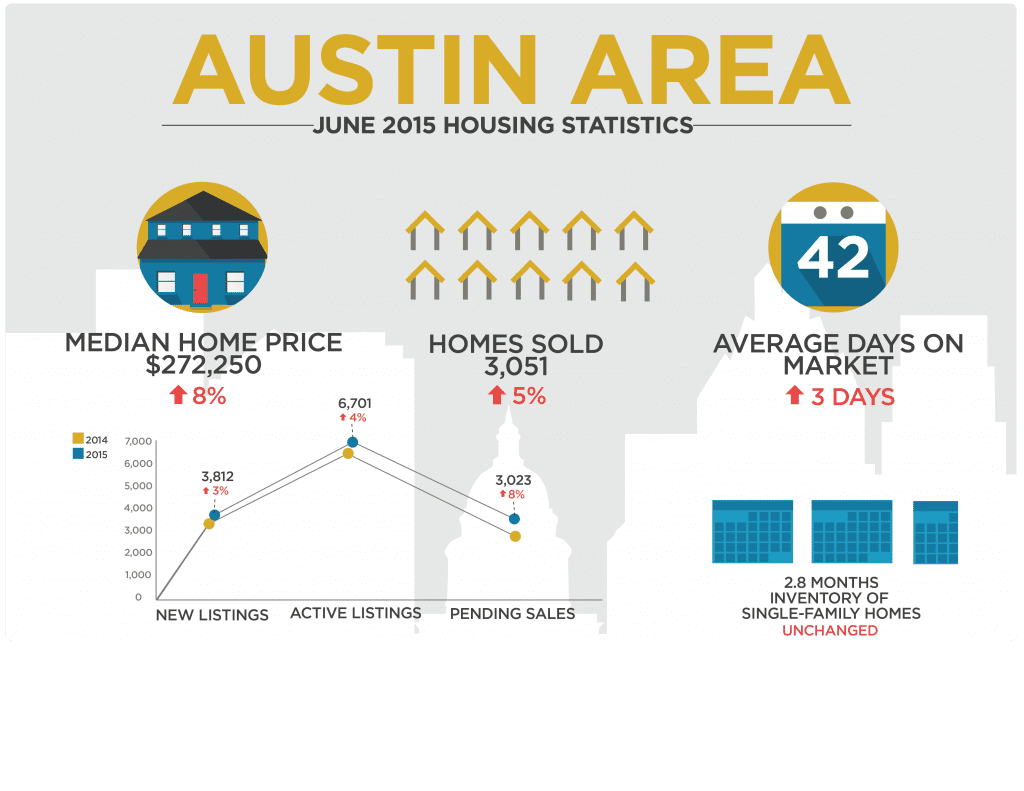
Active listings increased by four percent year-over-year to 6,701 listings in June 2015 and pending sales increased by eight percent to 3,023 compared to June 2014.

While new listings increased by three percent to 3,812 for June 2015, inventory held steady at 2.8 months, remaining well below the 6.5 month level the Real Estate Center at Texas A&M University estimates as a balanced housing market.

Cooper concluded, “While growth shows positive momentum for our city, ABoR supports solutions that serve the entire community, accommodate new populations and help residents find the homes they want. To help achieve these goals, ABoR and Austin REALTORS® recently met with members of the Austin City Council and Mayor Adler to discuss big picture issues affecting Central Texas residents and with a strong focus on sustainable and managed growth. We’re pleased to see the steps city leaders are taking toward a more affordable Austin.”

June 2015 Statistics

    • 3,051 – Single-family homes sold, five percent more than June 2014.
    • $272,250 – Median price for single-family homes, eight percent more than June 2014.
    • $333,866 – Average price for single-family homes, two percent more than June 2014.June 2015 Austin Real Estate Stats
    • 42 – Average number of days single-family homes spent on the market, three days more than June 2014.
    • 3,812 – New single-family home listings on the market, three percent more than June 2014.
    • 6,701 – Active single-family home listings on the market, four percent more than June 2014.
    • 3,023 – Pending sales for single-family homes, eight percent more than June 2014.
    • 2.8 – Months of inventory* of single-family homes, unchanged compared to June 2014.
  • $1,018,625,166 – Total dollar volume of single-family properties sold, eight percent more than June 2014.

2015 Mid-Year Statistics

    • 13,917 – Single-family homes sold, four percent more than the first half of 2014.
    • $263,000 – Median price for single-family homes, 10 percent more than the first half of 2014.
    • $331,765 – Average price for single-family homes, eight percent more than the first half of 2014.
    • 50 – Average number of days single-family homes spent on the market, three days more than the first half of 2014.
    • 19,865 – New single-family home listings on the market, three percent more than the first half of 2014.
    • 5,727 – Active single-family home listings on the market, eight percent more than the first half of 2014.
    • 15,984 – Pending sales for single-family homes, five percent more than the first half of 2014.
  • $4,617,178,959 – Total dollar volume of single-family properties sold, 12 percent more than the first half of 2014.

The following sections describe trends in other sectors of the Austin-area real estate market.

Townhouses & Condominiums

The volume of townhouses and condominiums (condos) purchased in the Austin area in June 2015 was 331, a 12 percent increase from June 2014. The median price for condos was $234,500, which is eleven percent more than the same month of the prior year. When compared to June 2014, these properties spent 8 more days on the market, or an average of 39 days.

For the first half of 2015, 1,510 Austin condos were sold, which is seven percent less than this time last year, while the median price was $226,250, or six percent more than the first half of 2014. Condos spent an average of 43 days on the market, one day fewer than the first half of 2014.

Leasing

In June 2015, a total of 1,861 properties were leased in Austin, which is fourteen percent more than June 2014. The median price for Austin-area home leases was $1,600, seven percent higher than in June 2014. In the first half of 2015, a total of 8,525 properties were leased in Austin, which is eight percent more than 2014, and the median lease price was $1,520, a five percent increase from the first half of 2014.
The Austin Board of REALTORS® (ABoR) builds connections through the use of technology, education and advocacy to strengthen the careers of its 11,000 members and improve the lives of Central Texas families. We empower Austin REALTORS® to connect their clients to the region’s most complete, accurate and up-to-date listings data. For more, contact the ABoR Department of Public Affairs at

[email protected] or 512-454-7636. For the latest local housing market listings, visitAustinHomeSearch.com.
* The inventory of homes for a market can be measured in months, which is defined as the number of active listings divided by the average sales per month of the prior 12 months. The Real Estate Center at Texas A&M University cites that 6.5 months of inventory represents a market in which supply and demand for homes is balanced.


All information above is credit to Austin Board of Realtors.

Share This:

January 2015 Austin Real Estate Stats

Austin Real Estate Market Statistics
Austin-area home prices hit all-time high for January, home sales rise in January 2015

Austin Board of REALTORS® releases real estate statistics for January 2015

AUSTIN, Texas – February 20, 2015 – The Austin-area housing market started the year strong in January 2015, with single-family home prices reaching all-time highs for the month of January and home sales posting double-digit increases according to the Multiple Listing Service (MLS) report released today by the Austin Board of REALTORS®. This marks the fifth-straight month of annual home sales increases and the fourth-straight month of double-digit gains in home prices, as housing affordability continues to be a challenge in the Austin market.

Barb Cooper, 2015 President of the Austin Board of REALTORS®, explained, “With housing affordability already a challenge for many Austin residents, this increasing pace of home price growth is concerning. More than half of the homes sold in the Austin-area are now priced out of an affordable range for much of Austin’s workforce.”

In January 2015, the median price for Austin-area homes increased 13 percent year-over-year to $240,000 and the average price jumped 14 percent to $310,187 during the same time frame. January 2015 marks the highest year-over-year home price increase since September 2013 and all-time high for home prices in the month of January.

According to the report, 1,547 single-family homes were sold in the Austin area in January 2015, an 11 percent increase compared to January 2014. However, 54 percent of the homes sold during this time frame were in the $200,000-$500,000 price range, whereas only 35 percent sold for less than $200,000 – the typical price range for first-time and low-income homebuyers.

“Housing inventory is rising, but the current pace is not enough to alleviate Austin’s affordability challenges,” added Cooper. “Furthermore, more homes on the market will not increase housing affordability if those homes are all priced for move-up homebuyers. Austin needs a regulatory environment that will ensure development of all housing types, priced in an affordable range for all Austin residents.”

Austin-area monthly housing inventory was 2.2 months in January 2015, 0.2 months higher than January 2014 but still well below the 6.5-month inventory level the Real Estate Center at Texas A&M University cites as a balanced housing market.

Active listings in January 2015 rose nine percent year-over-year to 5,005 listings, while new listings increased one percent to 2,360 listings from January 2014. Austin-area homes spent the same time on the market as January 2014, or an average of 63 days, and pending sales increased four percent to 2,026 sales during the same time frame.

Cooper concluded, “While single-family homes will always be a part of Austin’s fabric, Austin’s city leaders should consider housing types that cost less to develop and can allow for a greater range of affordable infill options, such duplexes and small apartment buildings, in neighborhoods where they are needed most. The Austin Board of REALTORS® is hopeful that the Austin City Council will embrace changes to the land development code and permitting process to allow for an abundance of housing in all neighborhoods.”

January 2015 Statistics

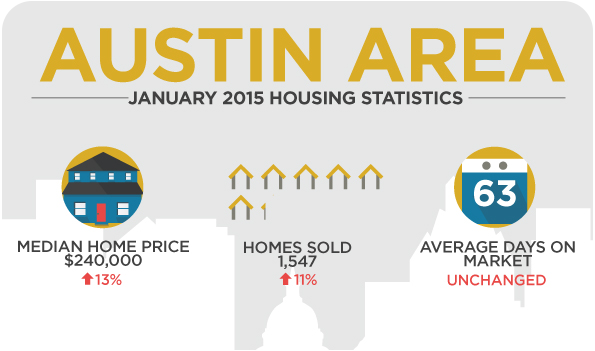
    • 1,547 – Single-family homes sold, 11 percent more than January 2014.
    • $240,000 – Median price for single-family homes, 13 percent more than January 2014.
    • $310,187 – Average price for single-family homes, 14 percent more than January 2014.Austin, TX January 2015 Housing Stats
    • 63 – Average number of days single-family homes spent on the market, unchanged from January 2014.
    • 2,360 – New single-family home listings on the market, one percent more than January 2014.
    • 5,005 – Active single-family home listings on the market, nine percent more than January 2014.
    • 2,026 – Pending sales for single-family homes, four percent more than January 2014.
    • 2.2 – Months of inventory* of single-family homes, 0.2 months more than January 2014.
    • $479,859,289 – Total dollar volume of single-family properties sold, 27 percent more than January 2014.

The following sections describe trends in other sectors of the Austin real estate market.

Townhouses & Condominiums

The volume of townhouses and condominiums (condos) purchased in the Austin area in January 2015 was 135, which is 30 percent less than January 2014. In the same time period, the median price for condos was $218,250, which is four percent more than the same month of the prior year. When compared to January 2014, these properties spent five fewer days on the market, or an average of 48 days.

Leasing

In January 2015, a total of 1,279 properties were leased in Austin, which is two percent more than January 2014. The median price for Austin-area home leases was $1,430, which is four percent more than the same month of the prior year.


All information above is credit to Austin Board of Realtors.

Share This:

December 2014 Austin Real Estate Stats

Austin Real Estate Market Statistics
Austin-area home sales set records for the month of December, annual home sales volume in 2014

Austin Board of REALTORS® releases real estate statistics for December 2014 and 2014 year-end totals

AUSTIN, Texas – January 21, 2014 – According to the December 2014 and Year-End 2014 Multiple Listing Service (MLS) report released today by the Austin Board of REALTORS®, the Austin-area housing market set a record for single-family home sales volume for the month of December, as well as a record for annual home sales volume in 2014. This marked the fourth-straight year of annual home sales increases.

Barb Cooper, 2015 President of the Austin Board of REALTORS®, explained, “The Austin area experienced a strong, stable housing market in 2014, with year-end 2014 showing similar market conditions to those one year ago. Last month, the U.S. Census Bureau named Austin the third-fastest growing big city in America since 2000. That steady job and population growth has continued to drive increases in home sales volume and, combined with low housing inventory levels, home prices as well.”

According to the report, 2,283 single-family homes were sold in the Austin area in December 2014, a 14 percent increase compared to December 2013 and an all-time high for Austin-area home sales in the month of December. In 2014, home sales volume slightly exceeded 2013 levels to set a new record for the number of Austin-area homes sold in a year with 27,768 homes sold, a two percent increase from 2013.

Over the course of 2014, median price increased eight percent over 2013 to $242,500. In December 2014, the median price for Austin-area homes was $246,530, 10 percent higher than December 2013. As a result, the total sales dollar volume for single-family homes in 2014 topped $8.6 billion, an increase of more than $673 million from 2013.

Housing inventory levels remained low in 2014, despite breaking an 18-month trend of monthly decreases in the second quarter of 2014. In December, Austin-area monthly housing inventory was 2.2 months, 0.2 months higher than December 2013 but still well below the 6.5-month inventory level the Real Estate Center at Texas A&M University cites as a balanced housing market.

This slow rise in housing inventory was driven by an influx of listings throughout the last half of 2014. Active listings in December 2014 jumped 12 percent year-over-year to 5,077 listings, while new listings rose 10 percent to 1,546 new listings from December 2013. Throughout the year, new and active listings each rose four percent in 2014 to 35,423 and 5,734 listings, respectively.

In 2014, homes spent an average of 47 days on the market, or three days fewer than homes sold in 2013, while pending sales increased one percent from 2013 to 28,325 sales. Homes sold in December 2014 spent three more days on the market than December 2013, or an average of 55 days, and pending sales increased 18 percent to 1,623 sales during the same time frame.

Cooper concluded, “The Austin-area housing market is consistent, but so are its challenges. More homes on the market, at all price ranges and throughout all areas of Austin, will be crucial to maintaining Austin’s affordability in 2015. As one of the fastest growing metropolitan areas in the U.S. we must look to our new city council for a regulatory environment that stimulates and grows housing stock in a healthy, sustainable way.”

December 2014 Statistics

  • 2,283 – Single-family homes sold, 14 percent more than December 2013.
  • $246,530 – Median price for single-family homes, 10 percent more than December 2013.
  • $311,082 – Average price for single-family homes, six percent more than December 2013.
  • 55 – Average number of days single-family homes spent on the market, three days more than December 2013.
  • 1,546 – New single-family home listings on the market, 10 percent more than December 2013.
  • 5,077 – Active single-family home listings on the market, 12 percent more than December 2013.
  • 1,623 – Pending sales for single-family homes, 18 percent more than December 2013.
  • 2.2 – Months of inventory* of single-family homes, 0.2 month more than December 2013.
  • $710,200,206 – Total dollar volume of single-family properties sold, 21 percent more than December 2013.

2014 Year-End Totals2014-Year-End-Austin-Stats-Thumbnail

  • 27,768 – Single-family homes sold, two percent more than 2013.
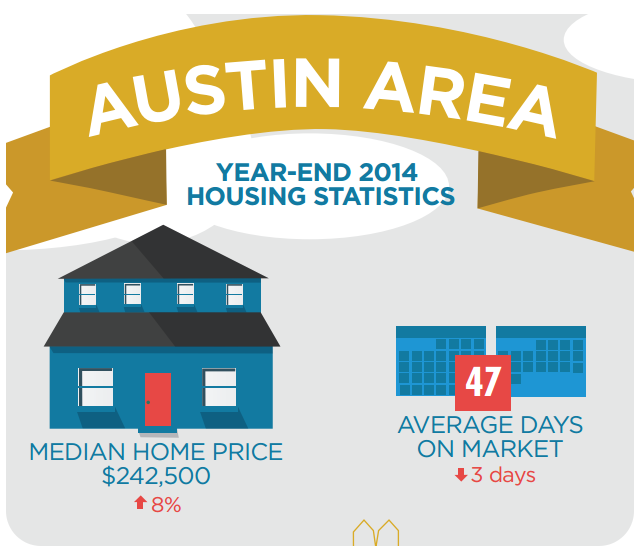
  • $242,500 – Median price for single-family homes, eight percent more than 2013.
  • $309,975 – Average price for single-family homes, seven percent more than 2013.
  • 47 – Average number of days that single-family homes spent on the market, three days fewer than 2013.
  • 35,423 – New single-family home listings on the market, four percent more than 2013.
  • 5,734 – Active single-family home listings on the market, four percent more than 2013.
  • 28,325 – Pending sales for single-family homes, one percent more than 2013.
  • $8,607,385,376 – Total dollar volume of single-family properties sold, nine percent more than 2013.

The following sections describe trends in other sectors of the Austin real estate market.

Townhouses & Condominiums

The volume of townhouses and condominiums (condos) purchased in the Austin area in December 2014 was 222, which is six percent more than December 2013. In the same time period, the median price for condos was $229,750, which is five percent more than the same month of the prior year. When compared to December 2013, these properties spent five additional days on the market, or an average of 55 days.

Over the course of 2014, 3,150 Austin condos were sold, which is statistically unchanged compared to 2013; the median price was $215,000, or 10 percent more than 2013; and condos spent an average of 43 days on the market, nine days fewer than 2013.

Leasing

In December 2014, a total of 1,214 properties were leased in Austin, which is 17 percent more than December 2013. The median price for Austin-area leases was $1,450, which is five percent more than the same month of the prior year. In all of 2014, a total of 16,960 properties were leased in Austin, which is four percent more than 2013, and the median lease price was $1,480, or six percent more than 2013.

The Austin Board of REALTORS® (ABoR) builds connections through the use of technology, education and advocacy to strengthen the careers of its 11,000 members and improve the lives of Central Texas families. We empower Austin REALTORS® to connect their clients to the region’s most complete, accurate and up-to-date listings data. 

* The inventory of homes for a market can be measured in months, which is defined as the number of active listings divided by the average sales per month of the prior 12 months. The Real Estate Center at Texas A&M University cites that 6.5 months of inventory represents a market in which supply and demand for homes is balanced.


All information above is credit to the Austin Board of Realtors.

Share This: